Viewing & Exporting Student and Course Reports
Student and Course progress reports can help you get a high level view of all progress made throughout your platform. You can quickly visualize how far along Learners are in specific courses, and dive deeper into the data if needed. All reports are also available to export as an Excel file, to easily share progress information or store for recordkeeping. If you are utilizing our Portals feature, you will also be able to view a single portal's data at a time for some of the reports by filtering the report.
This guide will walk you through each of the LMS report types (Overview, Course Insight, Student Insight, Learning Path Insight , Survey Report and Quiz Analysis), how to view them, and how to export their data as an Admin. Note that if you are a Portal Admin, you will be able to filter by Sub Portal, and have access to all these reports.
Please contact support if you have questions about the availability of this feature and adding it to your platform!
For more information on reports, please review our guide: Introduction to Reports
Types of LMS Reports
Each of the LMS Reports (Overview, Course Insight, Student Insight, Survey Report, Quiz Analysis) can be found on the Admin Dashboard, by going to Reports and then selecting the appropriate report from under the LMS Report heading.
The LMS reports include:
- Overview Report: shows information on your Learner's Self Paced Course progress broken down by Course.
- Learning Path Overview: The Learning Path Overview Report provides detailed information on your learners' progress, broken down by learning path. Admins can also filter this report by Portal.
- Course Insight Report: displays Self Paced Course progress for all the Learners in one Course. This can be filtered by Portal.
- Student Insight Report: allows you to view the progress of an individual Learner in all the courses they are enrolled in at once. This can be filtered by Portal.
- Learning Path Insight Report: allows you to view the progress of an individual Learner in all the learning paths they are enrolled in at once. This can be filtered by Portal.
- Survey Report: exports a report of Student's Survey responses if you're using Survey modules to collect feedback.
- Quiz Analysis: The Quiz Analysis Report gives you a detailed summary of a selected quiz.
Each of these reports can be exported to Excel, and the Course Insight and Student insight have a graph with a visual representation of your data, and a chart with more detailed information. Both the graph and chart can be filtered to give you a more granular view of your data.
Now let's go into each type of report in detail!
Viewing & Exporting the Overview Report
The LMS Overview Report provides information on your learners' progress, broken down by course, allowing you to quickly see how far along learners are in each specific course.
To view and/or export this report:
- From the Admin Dashboard, select Reports, then Overview Report.
- If you have multiple courses, select the type you want to view using the bar at the top.
Please note that courses may not be available to legacy users. The platform Admin can contact support for questions regarding the availability of this feature.
To view the report, simply navigate to it. To export, click Export Results at the bottom of the page.
Graph View
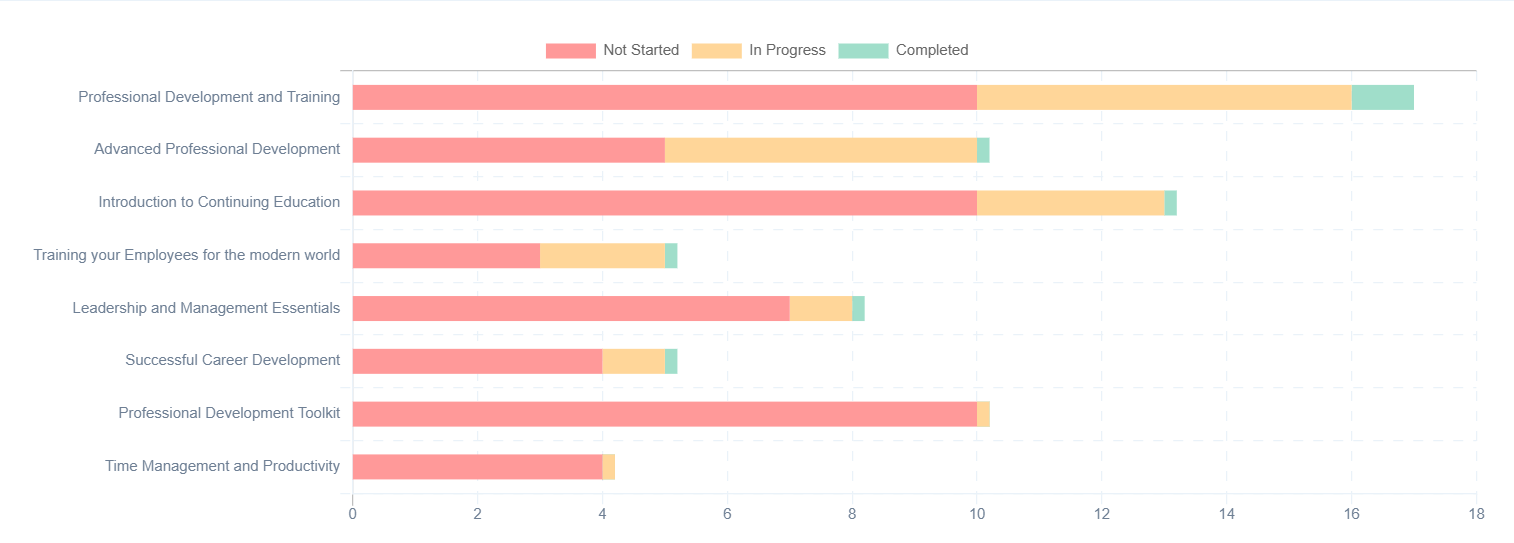
The LMS Overview Report graph provides a high-level view of your learners' progress in each course. Hovering over a single bar in the graph will display a breakdown of progress by numbers.
For each course, it shows how many learners have Not Started, are In Progress, or have Completed the course.
Chart
The LMS Overview Report chart displays the exact numbers for learner progress in each course. This chart can be exported at any time, or it can be further filtered before exporting.
For courses, it will appear as follows:
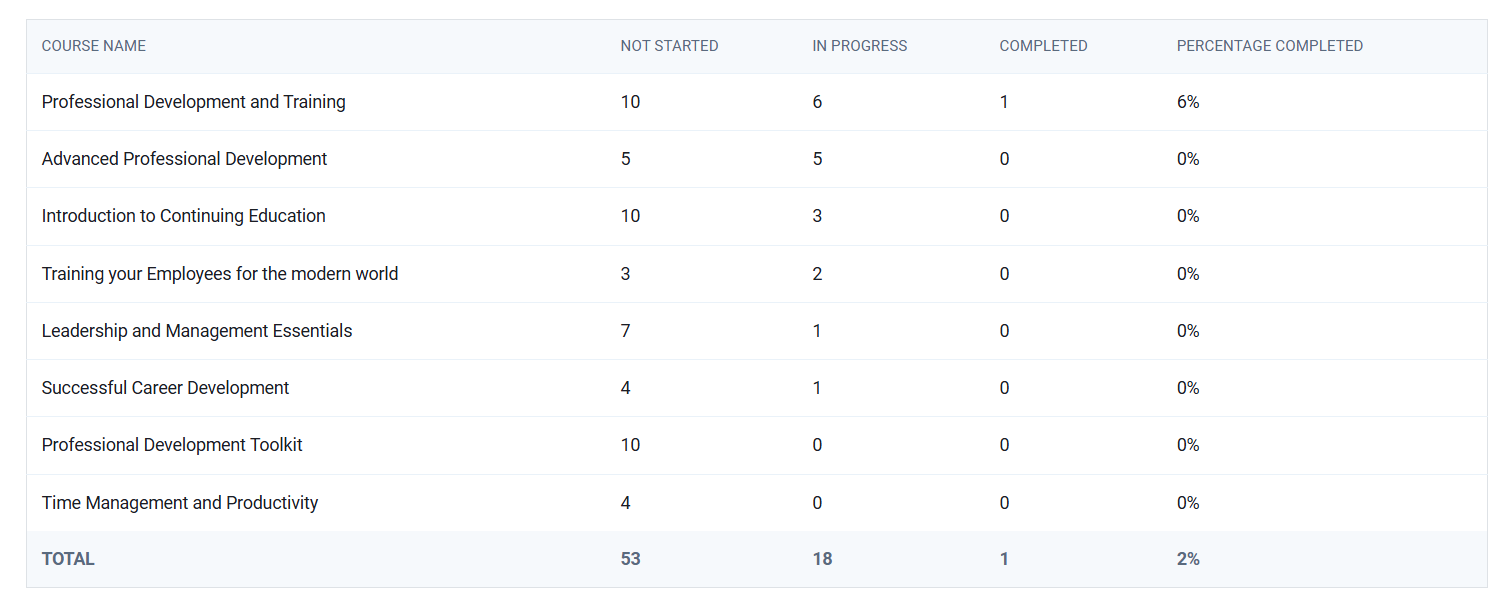
The following fields are included in the chart:
- Course Name
- Not Started
- In Progress
- Completed
- Percentage Completed
Filtering
The LMS Overview Report can be filtered by Portal. If you have Portals set up and enrolled in specific Courses, you can view only those Learners and remove any others who are also enrolled in the Courses.
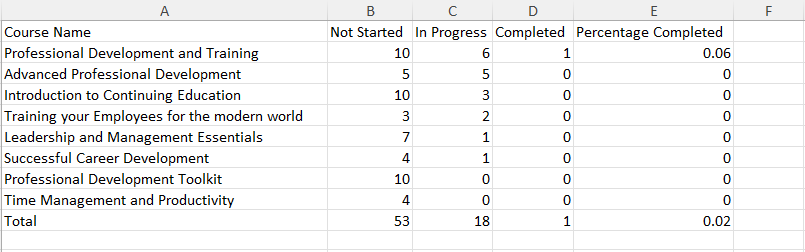
Export Results
This report provides an overview of learner progress across various courses, including the following metrics:
- Course Name: The name of the course.
- Not Started: The total number of learners who have not yet begun the course.
- In Progress: The total number of learners currently working on the course.
- Completed: The total number of learners who have completed the course.
- Percentage Completed: The percentage of learners who have completed the course relative to the total enrolled learners.
The Total row at the bottom summarizes overall progress across all courses, providing a snapshot of platform-wide learner activity.
This Excel file is designed for easy sharing, analysis, and recordkeeping, allowing you to track learner progress and make data-driven decisions to improve the curriculum.
Viewing & Exporting the Course Insight Report
The Course Insight Report is designed to display course progress for all learners in a single course. To begin viewing it, you must select one course to investigate.
- From the Admin Dashboard, select Reports, then Course Insight Report.
- Select a course to view by typing it into the search bar.
- View the report and filter by Learner or Status (and by Portal, if you are an Admin and not a Portal Admin).
- To export, click Export Results at the bottom of the page.
Graph View
The Course Insight Report pie chart provides a quick visual overview of learner progress in a specific course. Hovering over the chart will give you a breakdown of progress by numbers. For courses, it shows how many learners have Not Started, are In Progress, or have Completed the course.
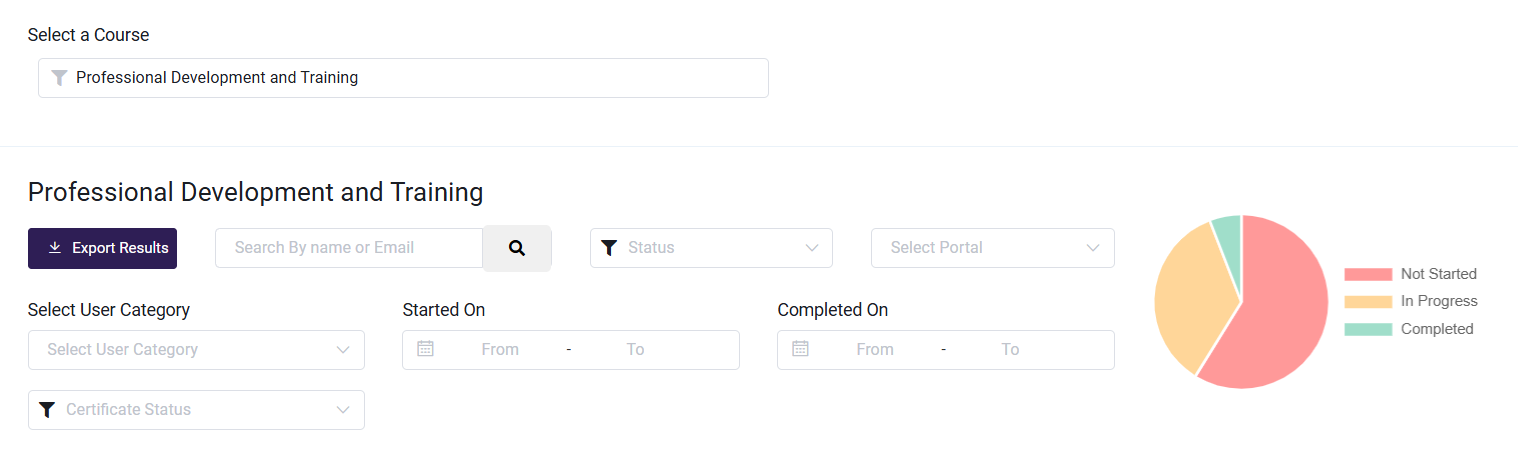
Chart View
The Course Insight Report chart provides a detailed breakdown of each learner's progress. For a self-paced course, it includes the student's final grade and whether a certificate was awarded. This chart can be exported at any time or further filtered before exporting.
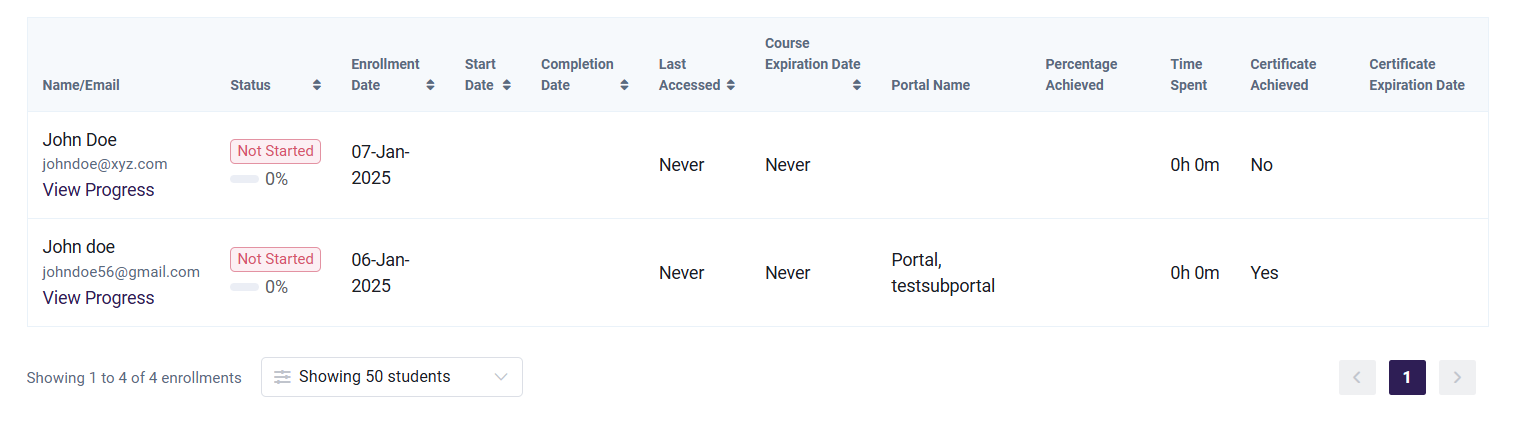
The following fields are included in the chart:
- Name/Email
- Status
- Enrollment Date
- Start Date
- Completed Date
- Last Accessed
- Percentage Achieved
- Time Spent
- Certificate Achieved
- Certificate Expiration Date
Filtering
The Course Insight Report chart can be filtered by Learner name and by progress status and Portal name.
Export Results
When exported, the LMS Course Insight Report chart will look like this:

Viewing & Exporting the Student Insight Report
The LMS Student Insight Report functions similarly to the Course Insight Report, but it allows you to view the progress of an individual learner across all the courses they are enrolled in, all at once. To begin viewing it, you must select a learner to investigate.
- From the Admin Dashboard, select Reports, then Student Insight Report.
- The platform Admin can contact support for any questions regarding the availability of this feature.
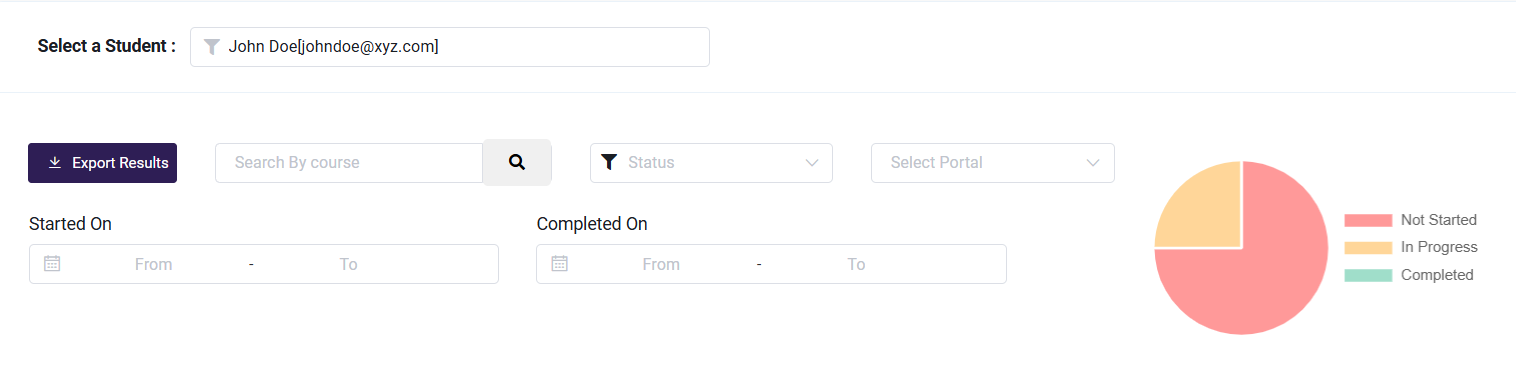
- Select a learner to view by typing their name into the search bar.
- View the report and filter by Course, Status (Not Started, In Progress, or Complete), or Portal if necessary.
- To export, click Export Results at the bottom of the page.
Graph
The Student Insight Report pie chart provides a quick visual overview of a single learner's progress across all the courses they are enrolled in. Hovering over the chart will give you a breakdown of progress by numbers.
For each course, it shows the learner's status: how many are Not Started, In Progress, or Completed.
Chart
The Student Insight Report pie chart provides a quick visual overview of a single learner's progress across all the courses they are enrolled in. Hovering over the chart will give you a breakdown of progress by numbers.
For each course, it shows the learner's status: how many are Not Started, In Progress, or Completed.
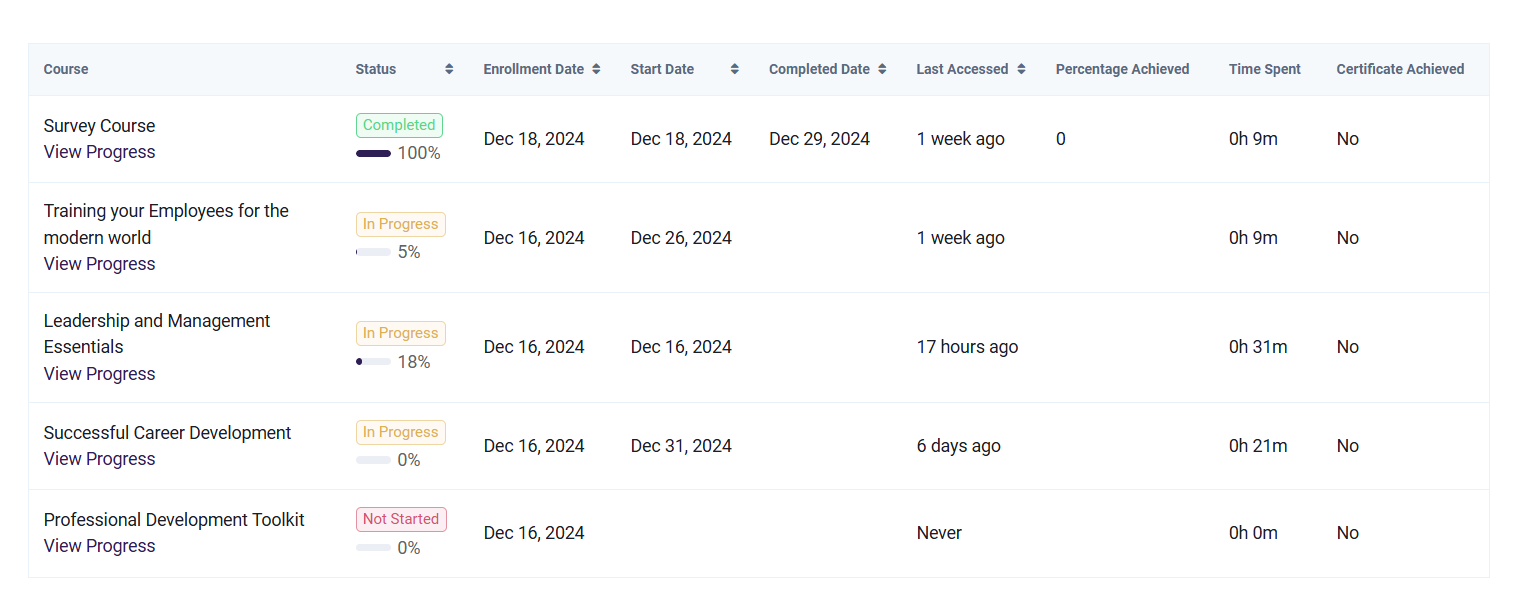
The following fields are included in the chart:
- Course
- Status
- Enrollment Date
- Start Date
- Completed Date
- Last Accessed
- Percentage Achieved
- Time Spent
- Certificate Achieved
Filtering
The Student Insight Report chart can be filtered by Course name, by progress status
Export Results
When exported, the LMS Student Insight Report chart will look like this:

Viewing & Exporting the Learning Path Insight Report
The Learning Path Insight Report is designed to display the progress of all learners in a single learning path. To begin viewing it, you must select one learning path to investigate.
- From the Admin Dashboard, select Reports, then Learning Path Insight Report.
- Select a learning path to view by typing it into the search bar.
- View the report and filter by Learning Path or Status (and by Portal, if you are an Admin and not a Portal Admin).
- To export, click Export Results at the bottom of the page.
Chart
The Learning Path Insight Report chart provides a detailed breakdown of each learner's progress. This includes the learner's final grade and whether a certificate was awarded. This chart can be exported at any time or further filtered before exporting.
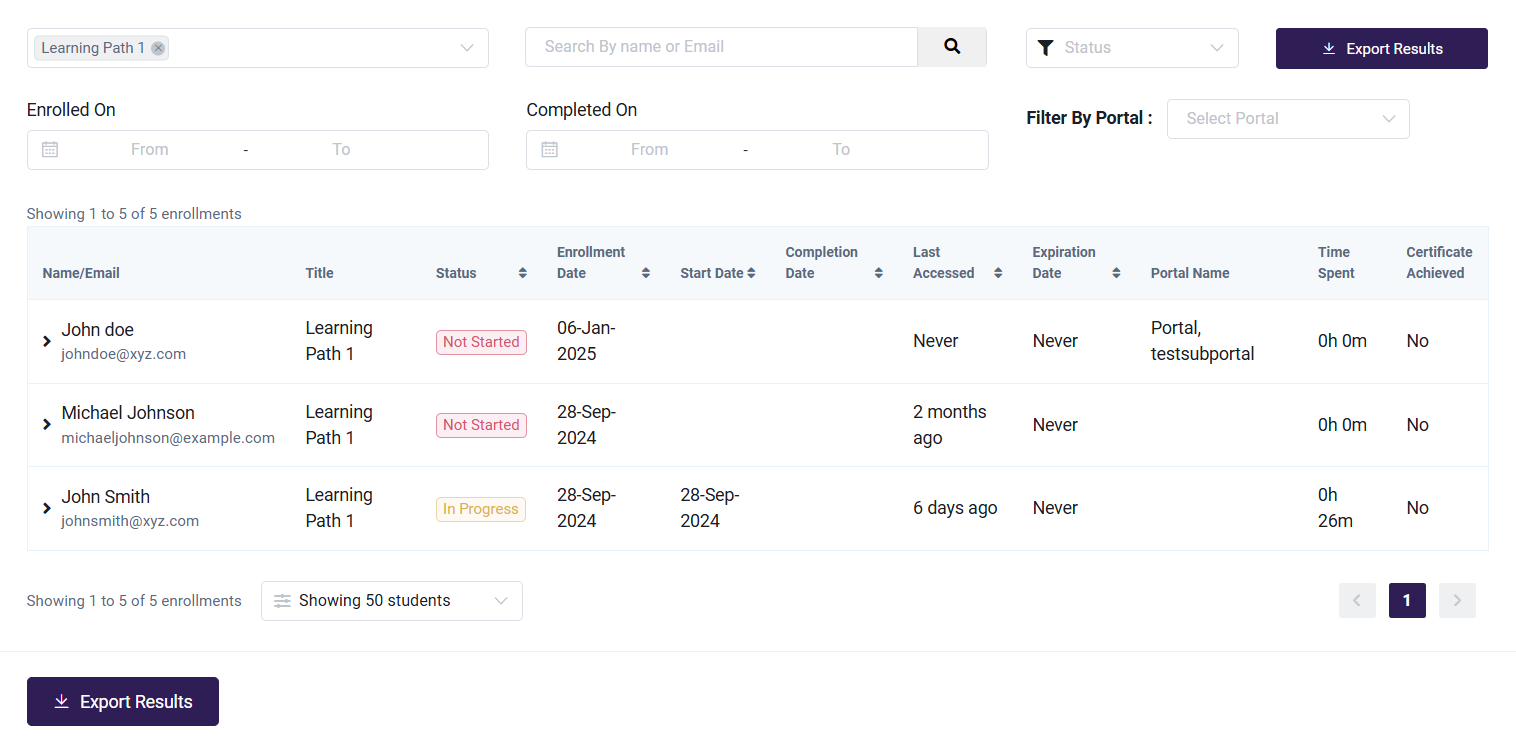
The following fields are included in the chart:
- Name/Email
- Title
- Status
- Enrollment Date
- Start Date
- Completion Date
- Last Accessed
- Expiration Date
- Portal Name
- Time Spent
- Certificate Achieved
Filtering
The Learning Path Insight Report chart can be filtered by Course name, by progress status
Export Results
When exported, the LMS Learning Path Insight Report chart will look like this:

Viewing & Exporting the Survey Report
The Survey Report allows you to export a bulk report of Learner's Survey responses for a Self Paced Course if you're using Survey modules to collect feedback.
- From the Admin Dashboard, select Reports, then Survey Report.
- Find the course you wish to view or search for it using the search bar.
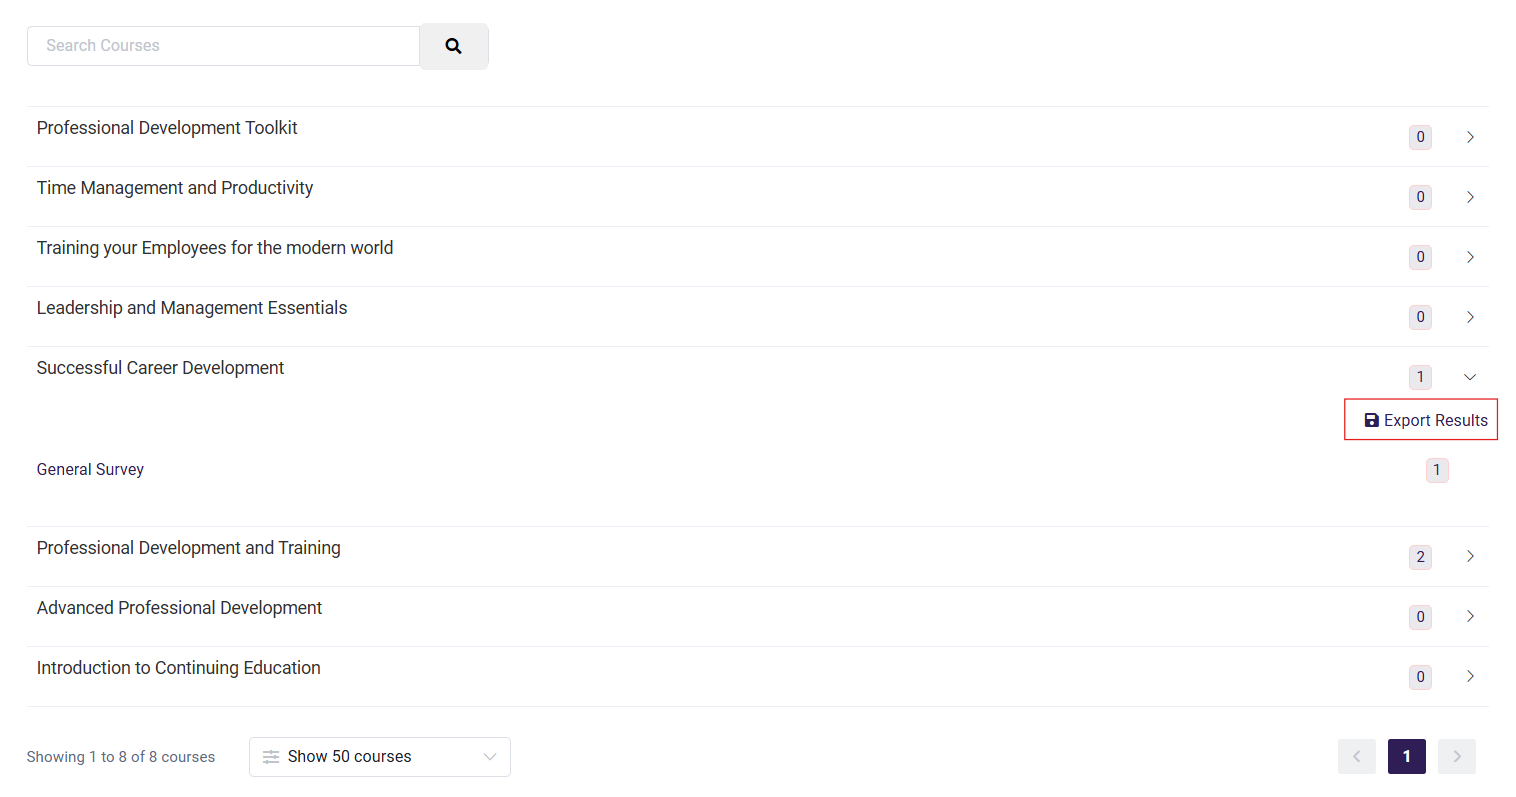
- Expand the report by clicking the down arrow. This will show you the name of the survey module and the number of responses received.
- To export, click Export Results.
- Clicking the name of the survey module when the bar is expanded will show a list of students who submitted the survey for that course.
Export Results
When exported, the report will look like this:

Quiz Analysis Report
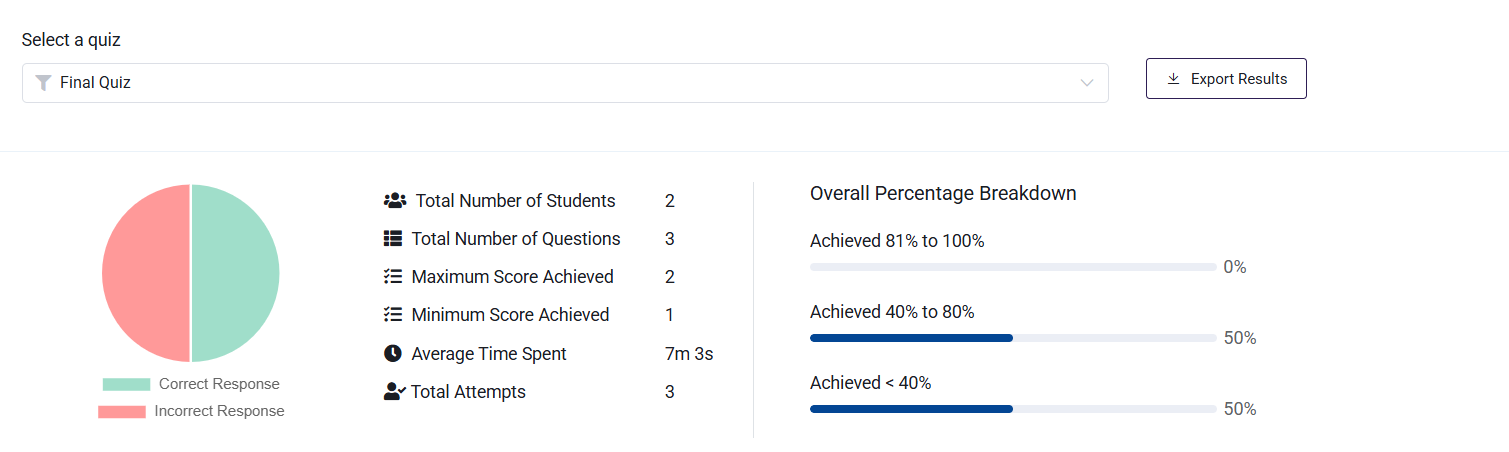
The Quiz Analysis Report provides a detailed summary of a selected quiz.
- From the Admin Dashboard, navigate to Reports, and select Quiz Analysis Report.
- Choose a quiz from the Select Quiz drop-down menu to view its analysis.
- To export the report, click the Export Results button next to the Select Quiz drop-down.
Metrics Included in the Quiz Analysis Report:
- Total Students Attempted: The number of students who have taken the quiz.
- Total Questions: The number of questions in the quiz.
- Maximum Score: The highest score achieved by a student.
- Minimum Score: The lowest score achieved by a student.
- Average Time Spent: The average time students spent completing the quiz.
- Total Attempts: The total number of quiz attempts, including retakes.
- Difficulty Level: The overall difficulty rating of the quiz.
- Pass/Fail Graph: A visual representation showing the percentage of students who passed and failed the quiz.
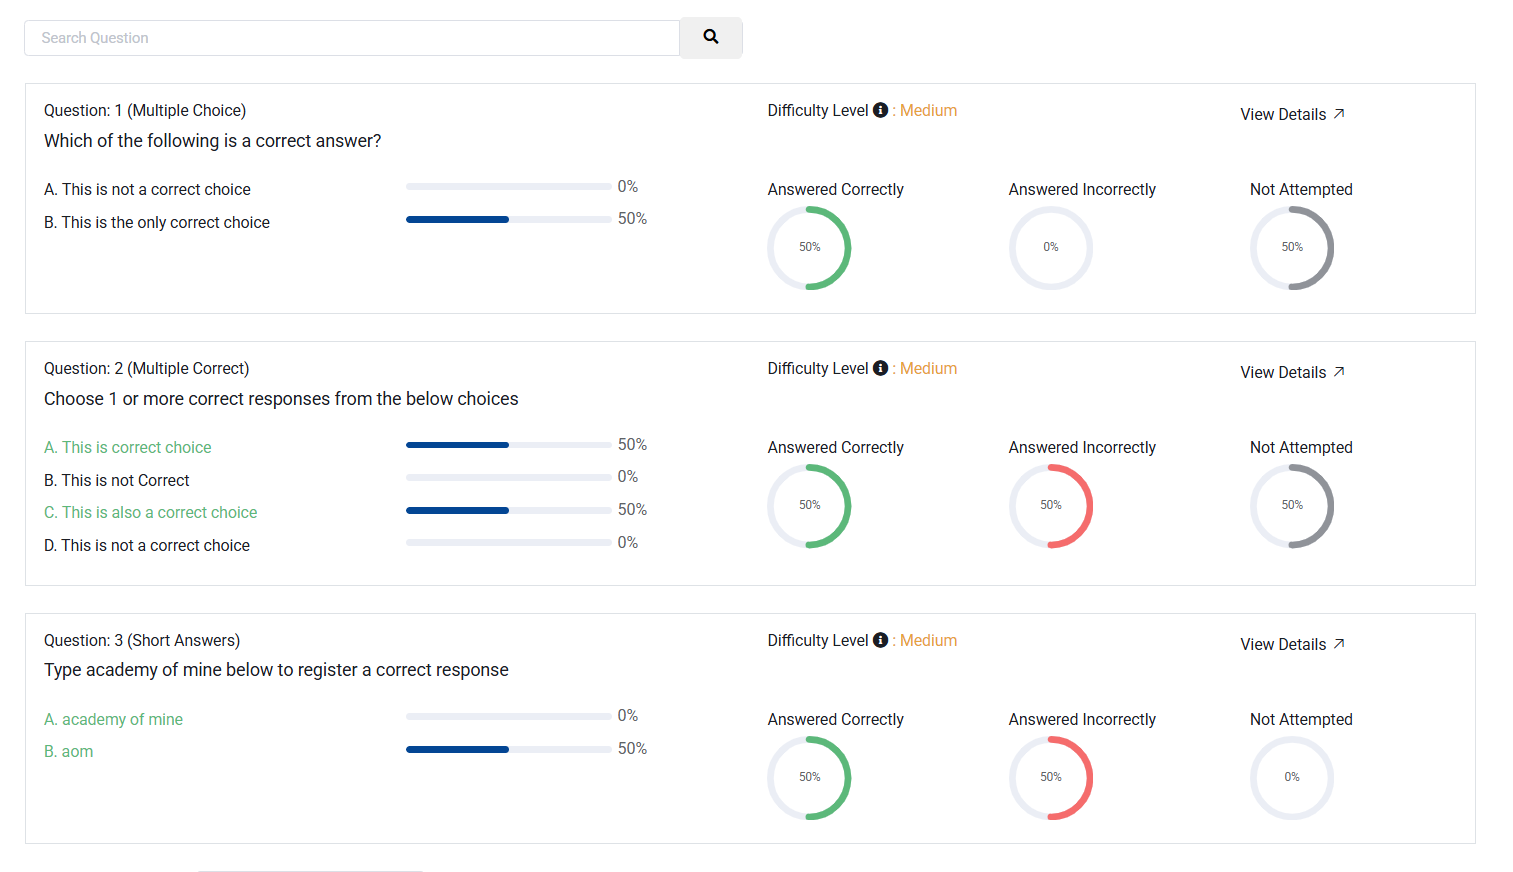
Additional Question Analysis in the Report
The Quiz Analysis Report also includes a detailed breakdown of each question in the selected quiz. A search filter is available to easily find specific questions.
Metrics Included for Each Question:
-
Question Title: Displays the title of the question.
-
Difficulty Level: Categorized as Easy, Medium, or Hard, based on the percentage of students who selected the correct option.
-
Question Options:
- Lists all answer options, with the correct option highlighted in green.
- For short-answer or match-answer type questions, only the correct answer is displayed.
-
Option Selection Percentage: The percentage of students who selected each option.
-
Attempt Summary: Displays percentages for the following
- Not Attempted
- Answered Incorrectly
- Answered Correctly
-
"View Details" Option: For each question, this feature provides submission details, including:
- Student Name
- Course Name
- Marked Answer
- Whether the response was correct (
Is Correct Response).
View Details pop-up
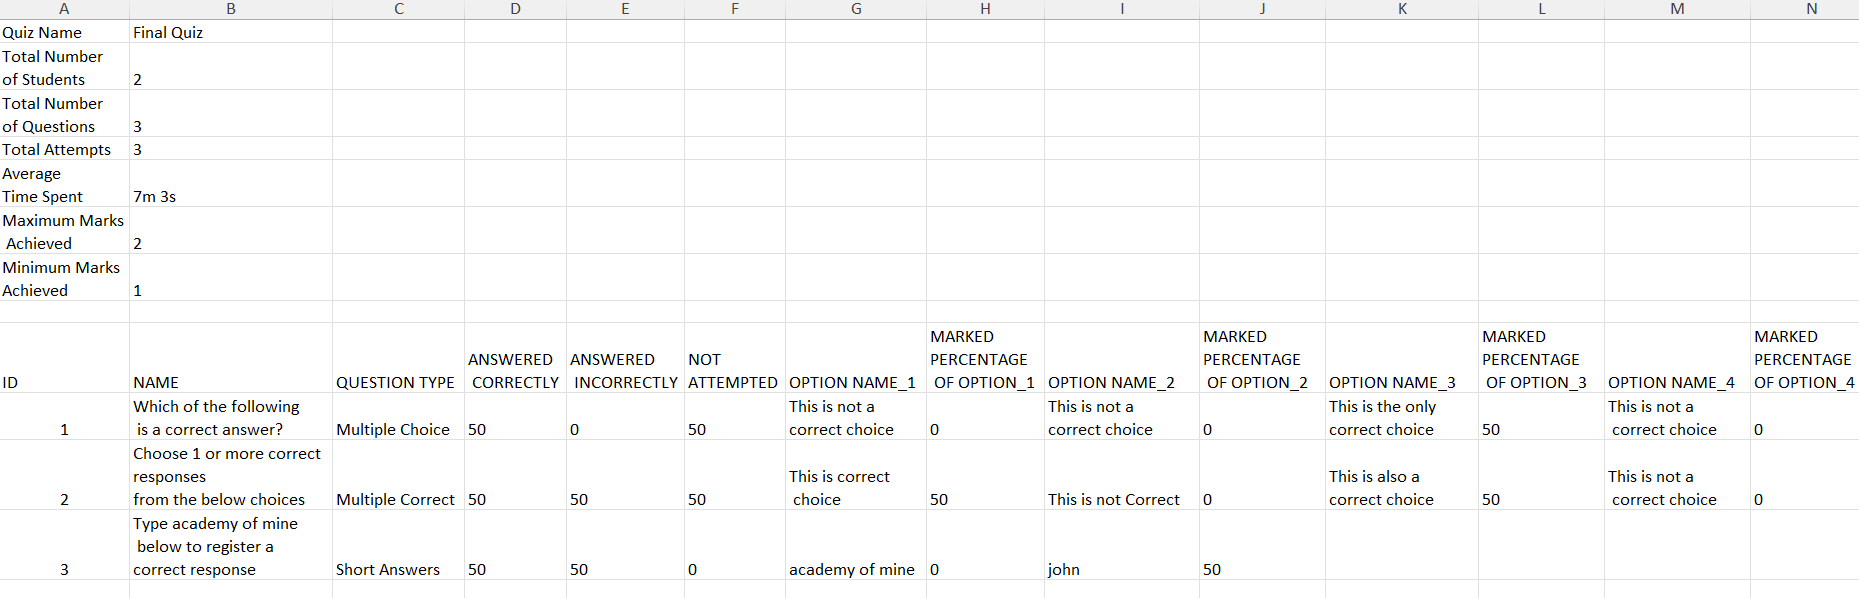
Export Results
When exported, the Quiz Analysis Report is provided as an Excel sheet, formatted as follows:
Next Step
Now that you have learned to view Student and Course-based progress reports, you can take a look at your eCommerce data in the revenue and orders reports: