View/Export Revenue & Order Reports
Revenue and Order Reports are essential tools for quickly assessing the health of your platform. Having all your sales data readily available can help you make informed decisions about marketing strategies, coupon deals, and new course offerings. These reports provide quick, visual displays of your past revenue and offer export options to assist with bookkeeping.
This guide covers everything you need to know about our eCommerce reports. The available reports include Yearly Sales, Product Breakdown, and Export Orders. We'll explain the data included in each report and how to view and export them.
For more information on reports, please review our guide: Introduction to Reports
Types of eCommerce Reports
Each of the eCommerce Reports can be found in the Admin Dashboard by going to Reports and then selecting the appropriate report from the eCommerce section.
The eCommerce reports are:
- Yearly Sales: This is a high level of all eCommerce reports. It can quickly show you your total sales and orders, broken down by month
- Monthly Sales: This is a high level of all eCommerce reports. It can quickly show you your total sales and orders, broken down by weeks
- Product Breakdown: This displays information on your orders made by Product. This allows you to quickly visualize trends in purchasing, and popularity of specific Courses
- Export Orders: This is used to find details on specific orders placed for your Products--choose your filters and then export to Excel to view
- Cart Abandonment: This section provides an overview of user interactions related to abandoned carts during the selected period.
The Yearly Sales and Product Breakdown reports operate in the same fashion. They all have a graph with a visual representation of your data, and a chart with more detailed information. Both the graph and chart can be filtered to give you a more granular view of your data, and can be exported to For the Export Orders, you will need to export to Excel to view the information.
Yearly Sales Report
The Yearly Sales Report is the most high level of all eCommerce reports. It can quickly show you your total sales and orders, broken down by month.
- From the Admin Dashboard, select Reports, then Yearly Sales Report
- View the report and change the year in the Year Picker if needed
- To export, click Export Results at the bottom of the page
Graph
The Yearly Sales Report bar graph shows a visualization of the number of orders placed and money earned as broken down by each month of the year. The chart is displayed to the right of the graph, and the entire report can be filtered by year.
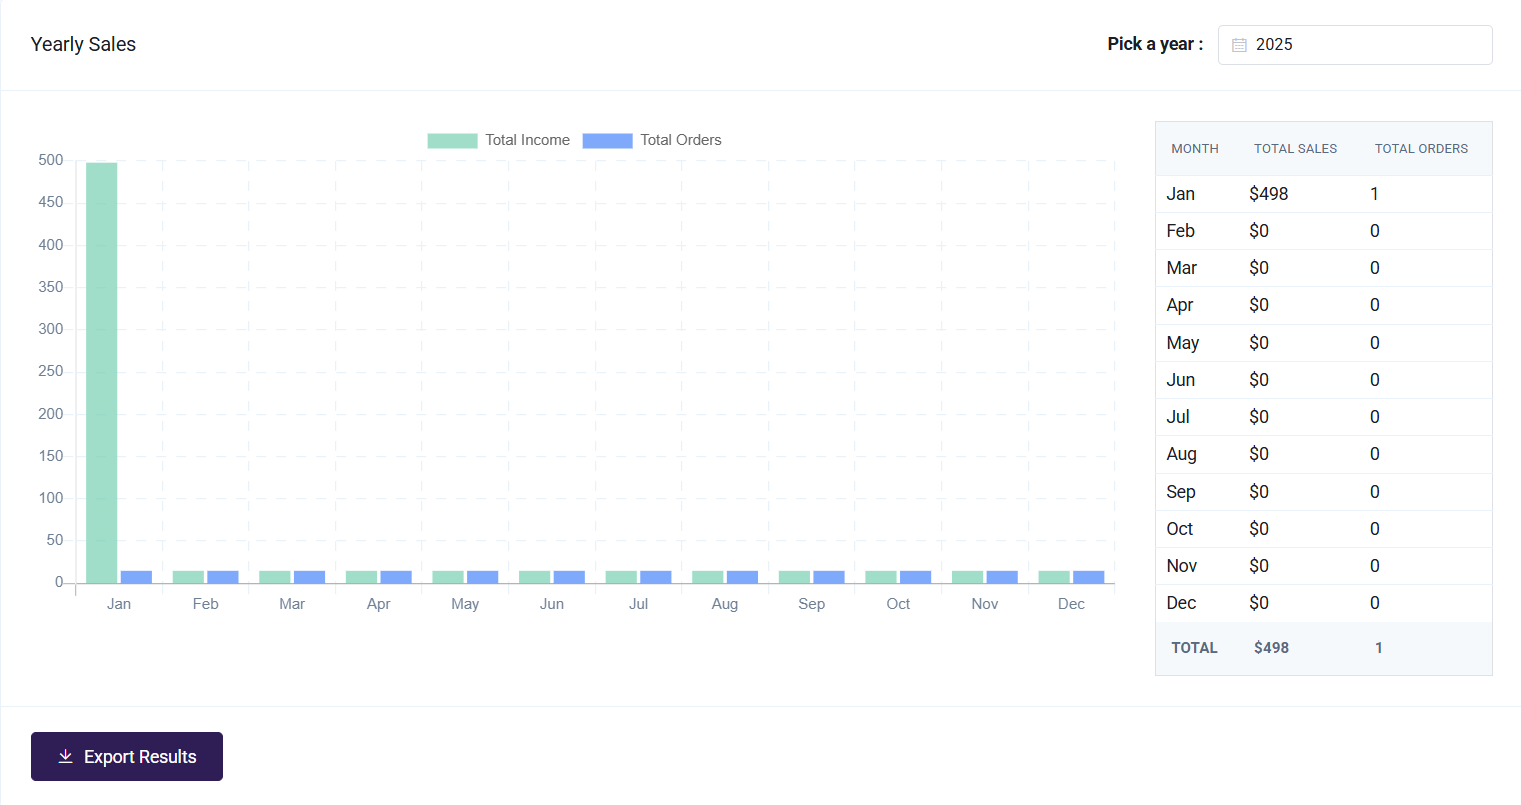
The following fields are included in the chart:
- Month
- Total Sales
- Total Orders
Filtering
The Yearly Sales Report chart can be filtered by year, to show all twelve months.
Export Results
When exported, the Yearly Sales Report chart will look like this:

Monthly Sales Report
The Monthly Sales Report provides an overview of your total sales and orders, broken down by each week of the month.
- From the Admin Dashboard, select Reports, then Monthly Sales.
- View the report and change the month or year in the Month and Year Picker, if needed.
- To export, click Export Results at the bottom of the page.
Graph
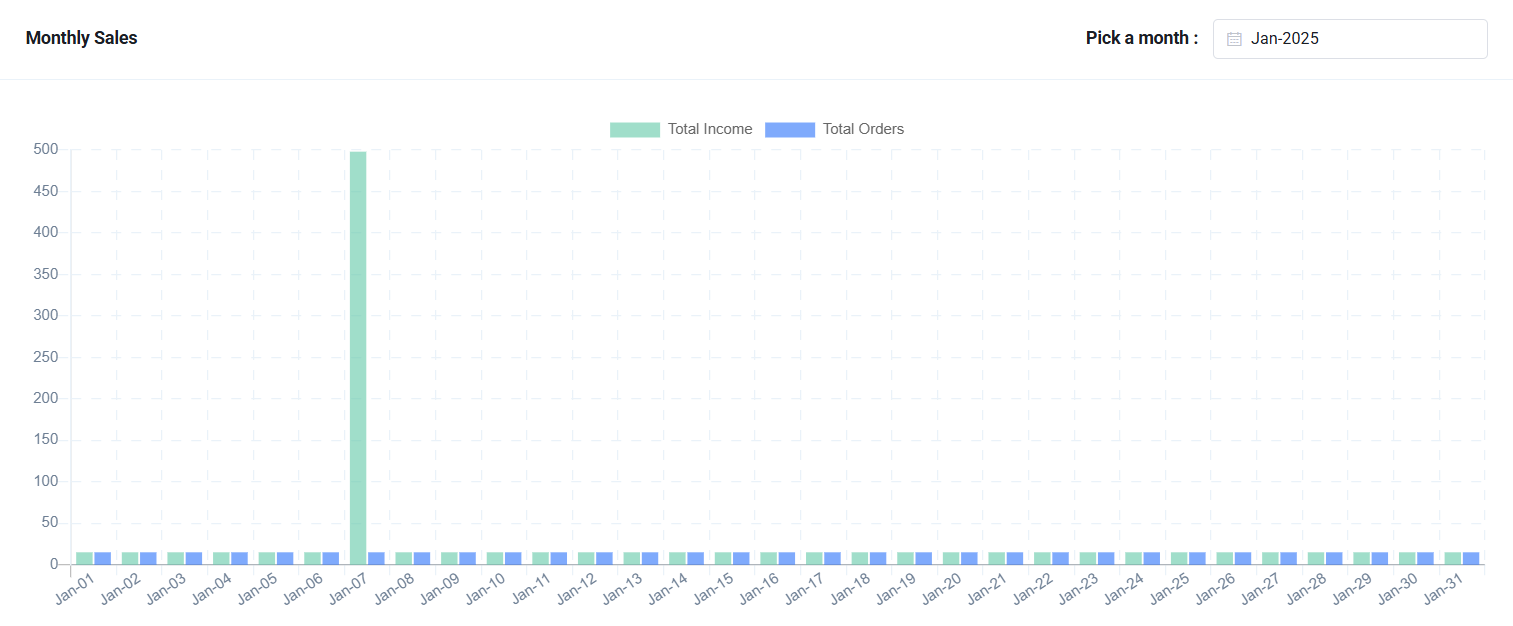
The Monthly Sales Report bar graph provides a visualization of the number of orders placed and revenue earned, broken down by week within the selected month. A detailed chart is displayed to the right of the graph, and the entire report can be filtered by month and year.
Chart
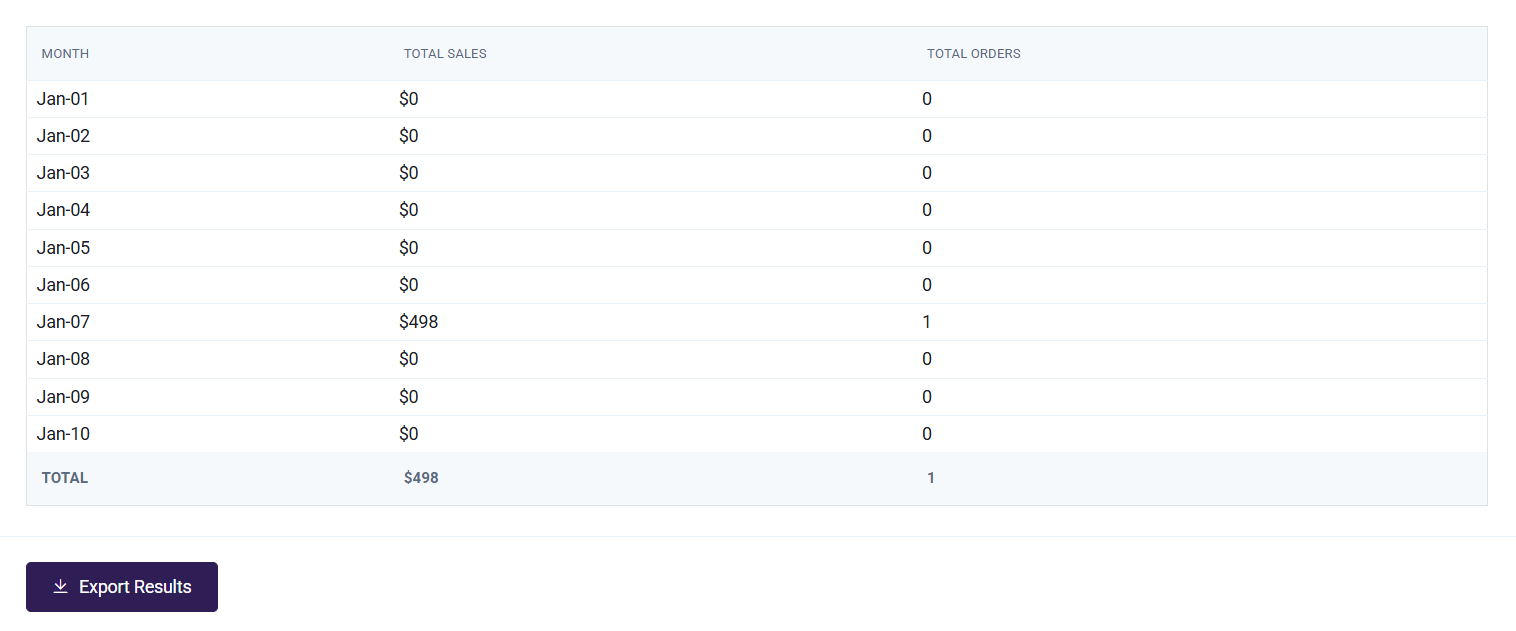
The Monthly Sales Report chart provides a detailed breakdown of weekly sales and orders. It displays specific figures for revenue and the total number of orders for each week. This chart is displayed below the graph and can be filtered by month and year. It can also be exported for further analysis or recordkeeping.
Exporting the Monthly Sales Report
The exported Monthly Sales Report provides a comprehensive summary of your platform's performance, including the following key fields:
- Month: The name of the month for the recorded data.
- Total Sales: The total revenue generated during the month.
- Total Orders: The total number of orders placed during the month.

Product Breakdown Report
The Product Breakdown Report provides detailed information on orders categorized by product. This allows you to quickly identify purchasing trends and the popularity of specific courses.
- From the Admin Dashboard, select Reports, then Product Breakdown Report.
- View the report and select the desired month using the month selector.
- To export, click Export Results at the bottom of the page.
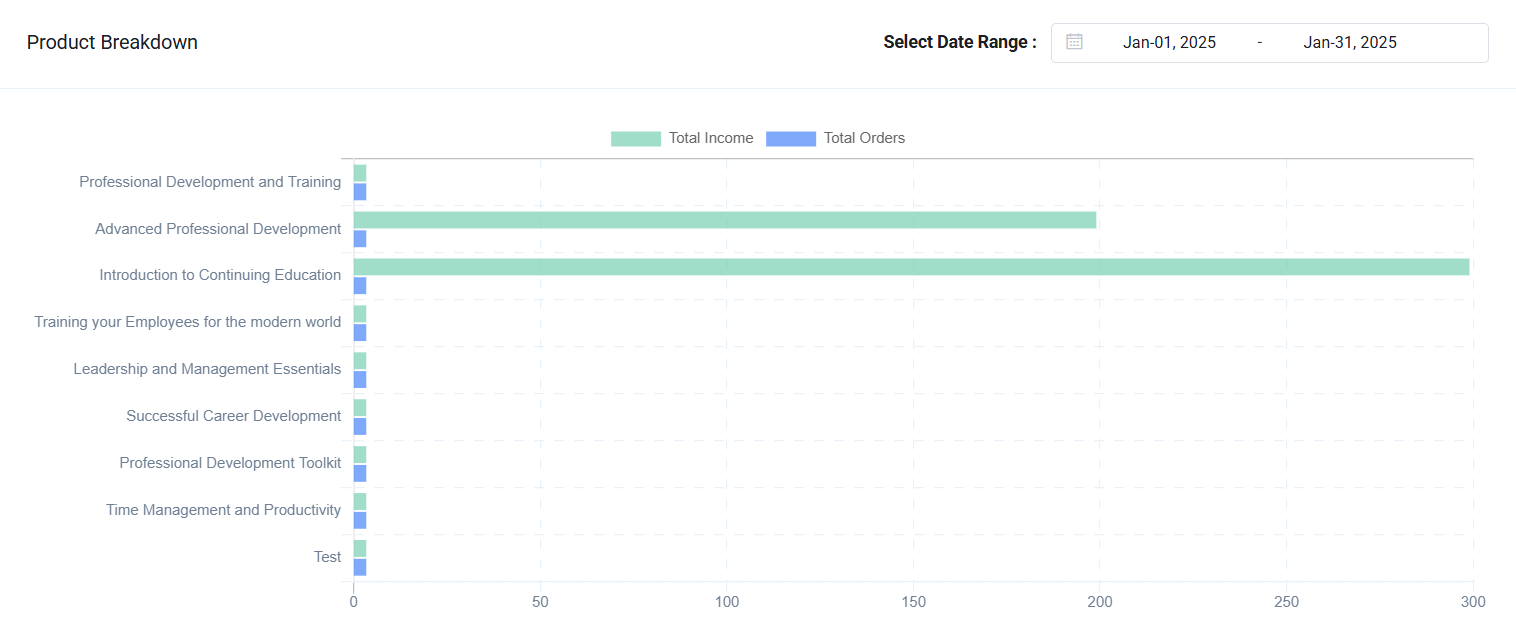
Graph
The Product Breakdown Report Graph provides a clear visual representation of product performance over the selected date range. The graph compares Total Income (displayed in green) and Total Orders (displayed in blue) for each product, allowing users to identify trends in revenue and order volume.
Chart
The Product Breakdown Report Chart provides a detailed overview of the total sales and total orders for each product. This chart can be exported at any time or further refined using filters before exporting.
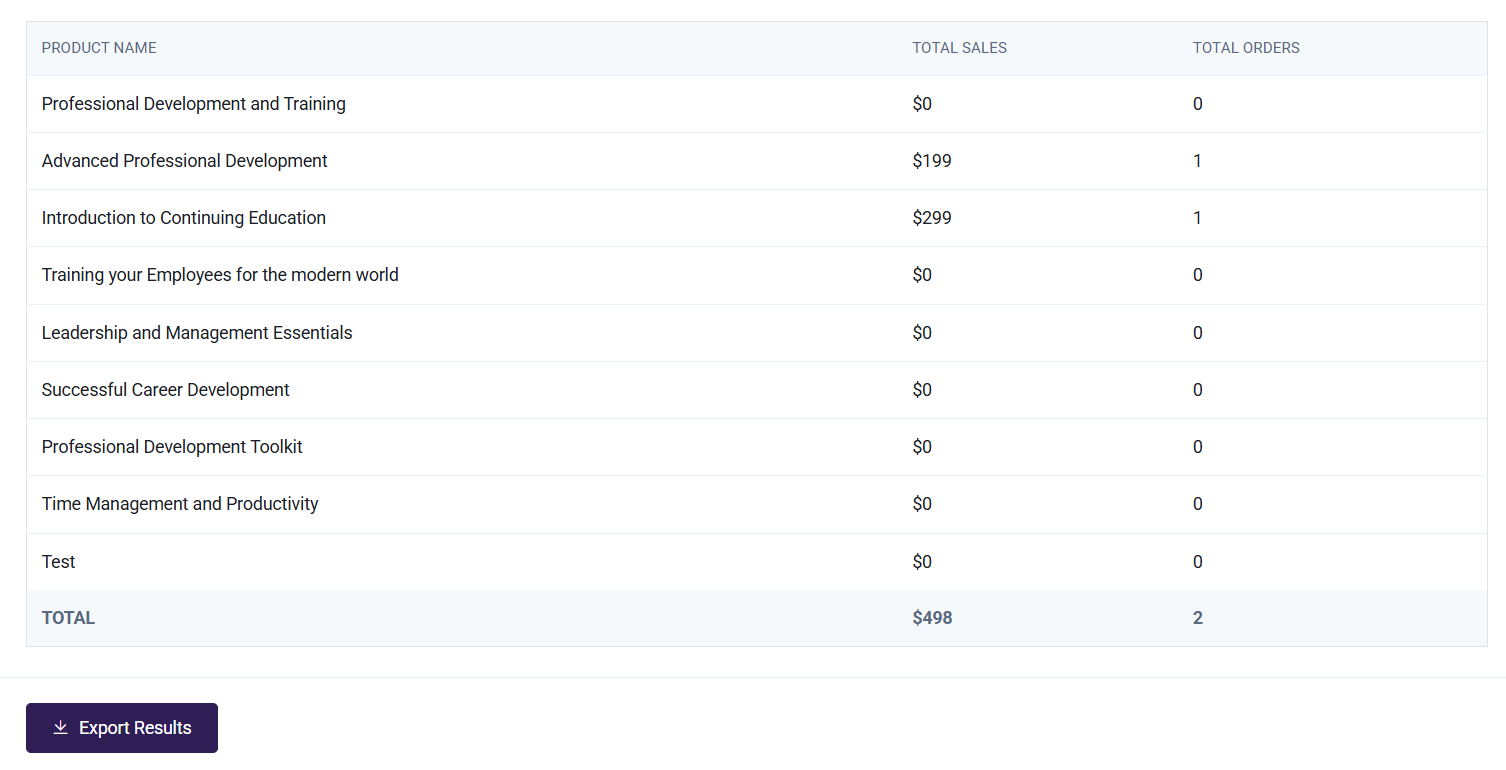
The following fields are included in the chart:
- Product Name
- Total Sales
- Total Orders
Filtering
The Product Breakdown Report chart can be filtered by month
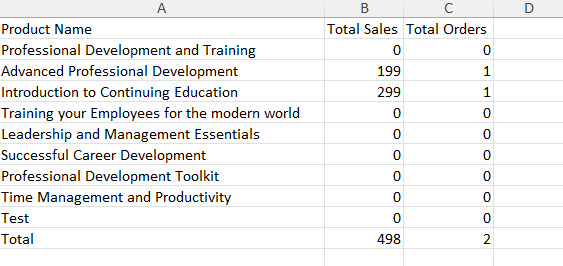
Export Results
When exported, the Product Breakdown Report chart will look like this:
Orders Report
The Orders Report is designed to provide detailed information about specific orders placed for your products. This tool allows you to search your entire order history and filter by multiple fields. Unlike other reports, this report does not display data visually but instead exports it directly to an Excel spreadsheet.
To access the report:
- From the Admin Dashboard, select Reports, then Orders Report.
- Filter the report as needed to refine your search.
- To view the results, click Export Results at the bottom of the page.
For more information on orders, please review our guide: Managing eCommerce Orders/Invoices
Filtering
Orders Reports can be filtered by Date Range, Order Status, Payment Method, Customer Name, Product Name or by Coupons Used.
Show Underlying Products - Chooses whether to list the order as a single total, or individually list each product included within the order.
Show Test Orders - When enabled, includes Test Orders in a report.
Show Underlying Products - Show each product of the order on a separate row.

Export Results
When exported, Orders Reports will look like this:

Cart Abandonment
Cart abandonment occurs when users add products to their shopping cart but leave the website without completing their purchase. This common issue impacts potential sales and represents a significant opportunity to recover lost revenue.
How It Works:
- Users visit the website and browse products.
- They add items to their cart, indicating interest in purchasing.
- However, for various reasons—such as distraction, price concerns, or a complicated checkout process—they do not finalize their order and leave the site.
To address cart abandonment, we send automated cart recovery emails to these users. These emails serve as reminders of the items left in their cart, encouraging them to return and complete their purchase.
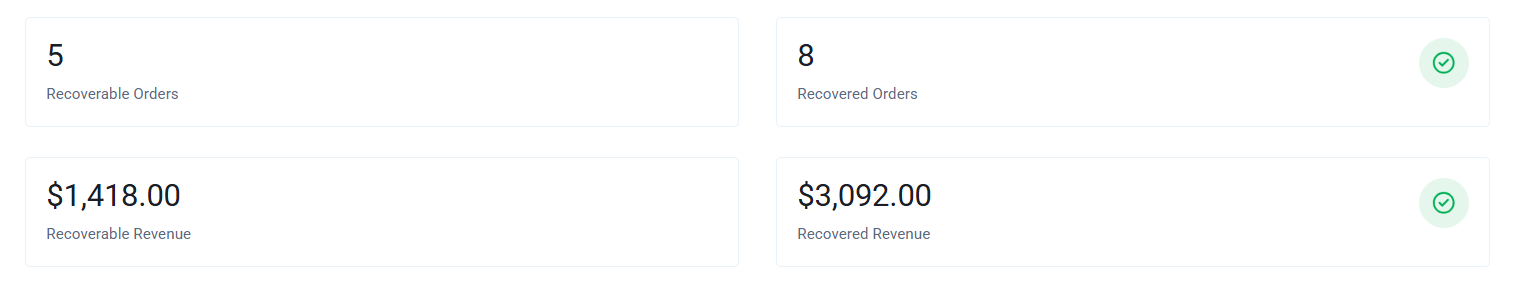
Overview
Recoverable Orders: Represents the total number of users who added items to their cart but did not complete the purchase. These users can potentially be converted into buyers with targeted follow-ups or reminders.
Recoverable Revenue: The total estimated revenue that can be recovered if all users with abandoned carts complete their purchases.
Recovered Orders: Indicates the number of users who successfully completed their purchases after follow-up actions, converting their abandoned cart into actual orders.
Recovered Revenue: The total revenue earned from users who returned to complete their purchases after abandoning their carts.
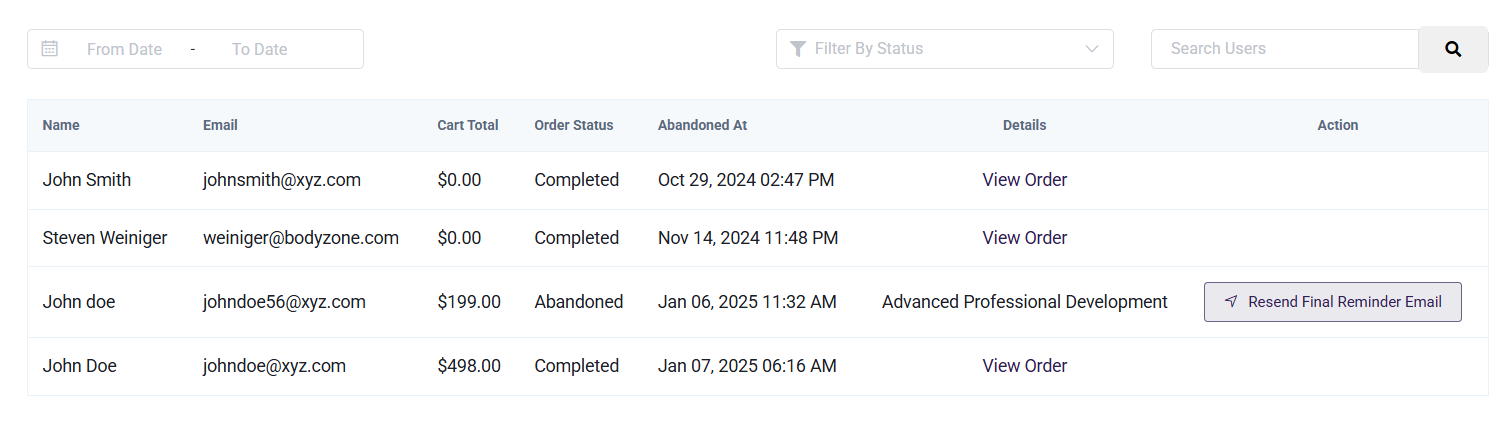
Chart
The chart presents a tabular view of:
- Name and Email: Identifies the users who abandoned or completed purchases.
- Cart Total: Displays the value of items in the user’s cart.
- Order Status: Shows whether the cart is "Completed" or "Abandoned."
- Abandoned At: Provides the date and time when the cart was abandoned or completed.
- Details: Includes the specific items or courses associated with the cart.
- Actions: Offers options to re-engage users, such as resending reminder emails for abandoned carts.
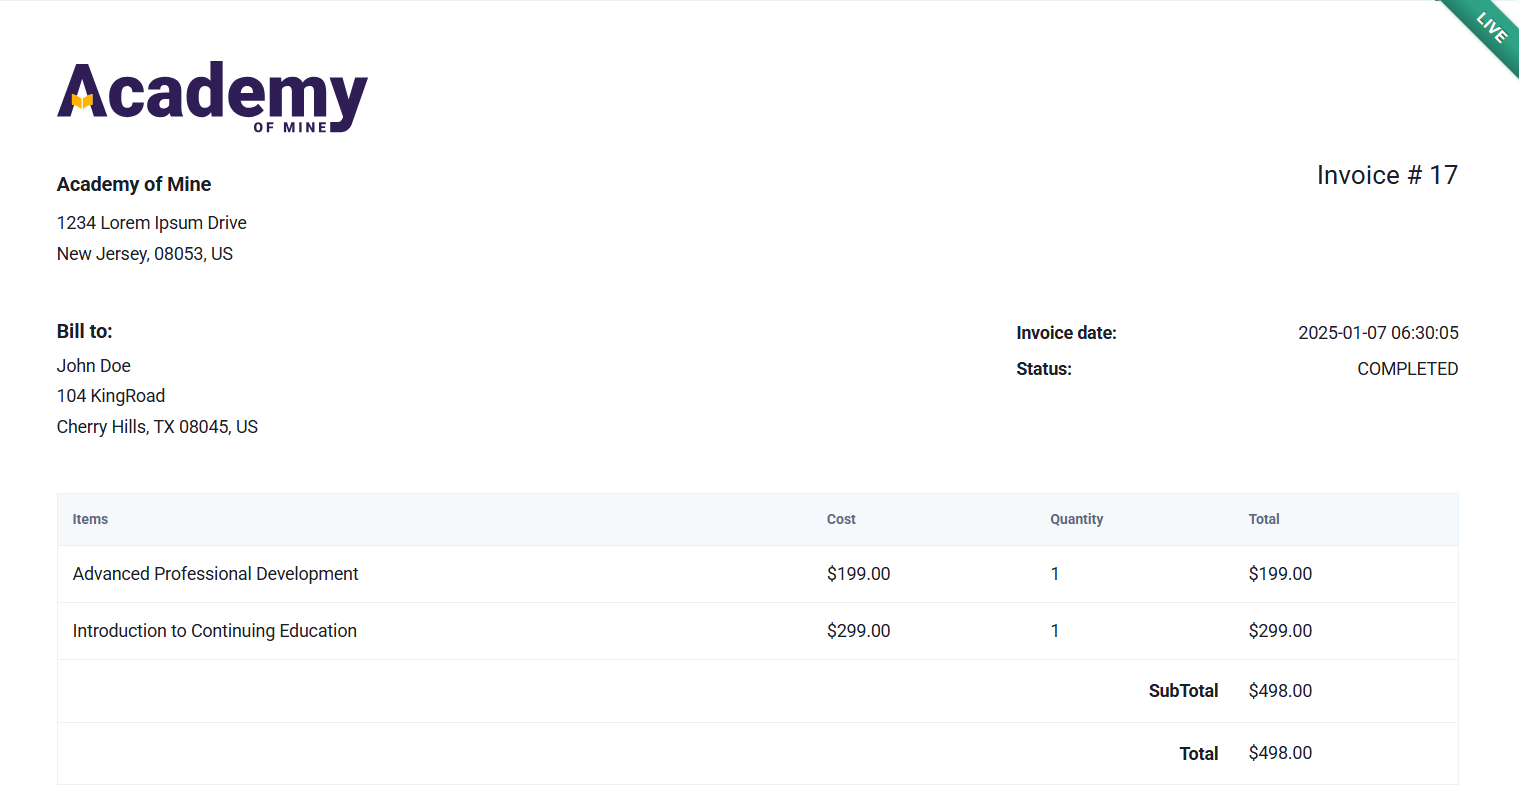
Order Details
When you click on View Order, you can access detailed information about a specific order. This page provides a comprehensive overview